Introduction
The JDE Atina Panel Manager is a client-side tool that runs alongside the Atina JDE Microservice. It provides a browser-based dashboard to:
-
Check the status of the Atina JDE Microservice
-
View active connections in real time
-
Capture logs and configuration files needed to open a support incident
-
Run basic validation tests against the microservice (BSFN and Web Services)
Requirements:
-
Java 8 or higher (JRE or JDK)
-
Docker running, with the
jd-atina-microservercontainer active -
Network access to the JDE Atina Microservice (gRPC)
Installing the Application
-
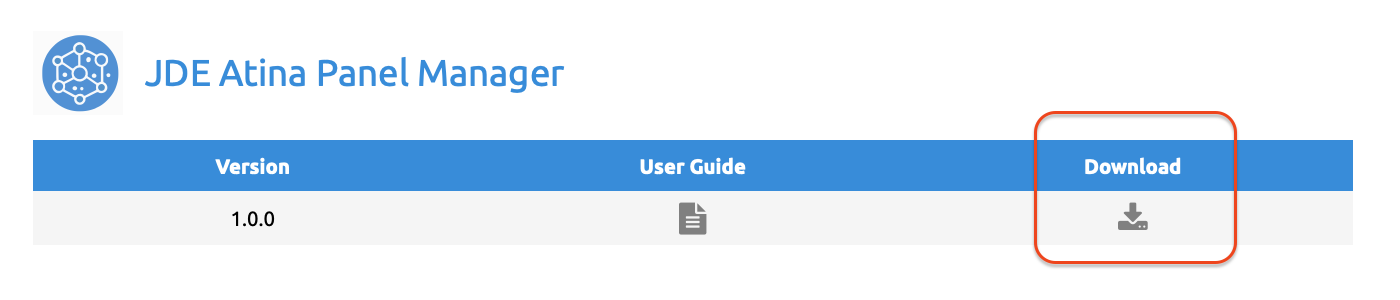
Download the ZIP distribution provided by Atina (
JDEAtinaPanelManager-1.0.0.zip).
-
Unzip it into a folder on the machine where you will run the tool. It contains:
File Description JDEAtinaPanelManager.jarThe application
start.shStartup script for Linux/Mac
start.batStartup script for Windows
README.txtQuick reference (parameters and troubleshooting)
-
Run
start.sh(Linux/Mac) orstart.bat(Windows), or launch the JAR directly withjava -jar JDEAtinaPanelManager.jaras described below.
Starting the Application
The Panel Manager can be started in three ways, depending on how much information you provide on the command line.
Option 1 - No Parameters
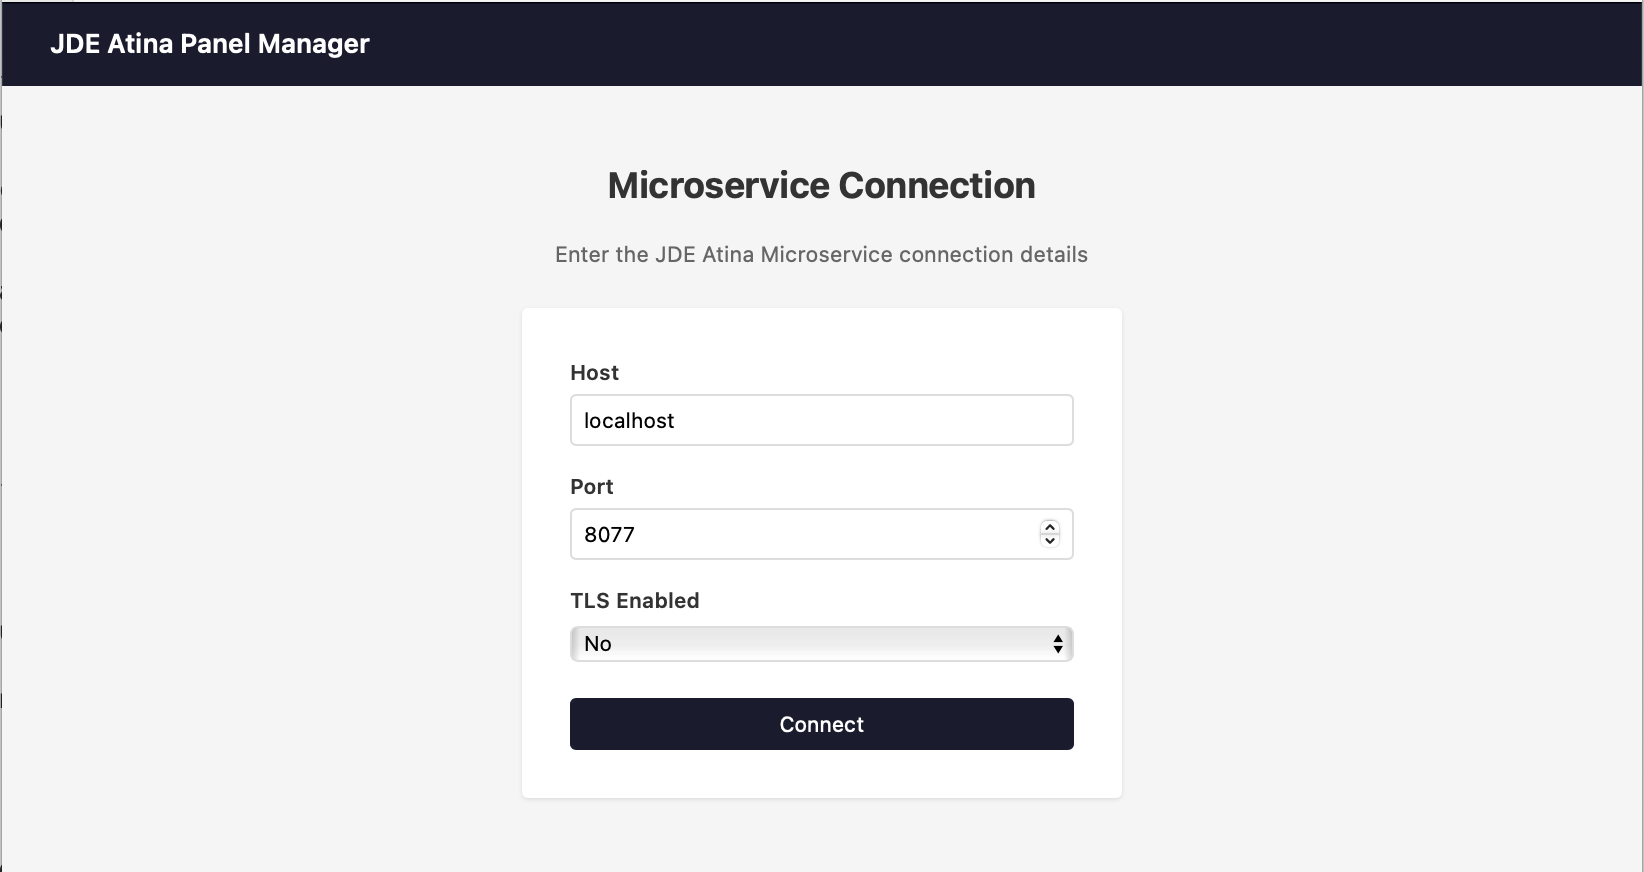
java -jar JDEAtinaPanelManager.jarSince no microservice address was provided, the Panel opens in the browser and first asks for the connection details: Host, Port, and whether TLS should be enabled.
Option 2 - Specifying the Microservice Address
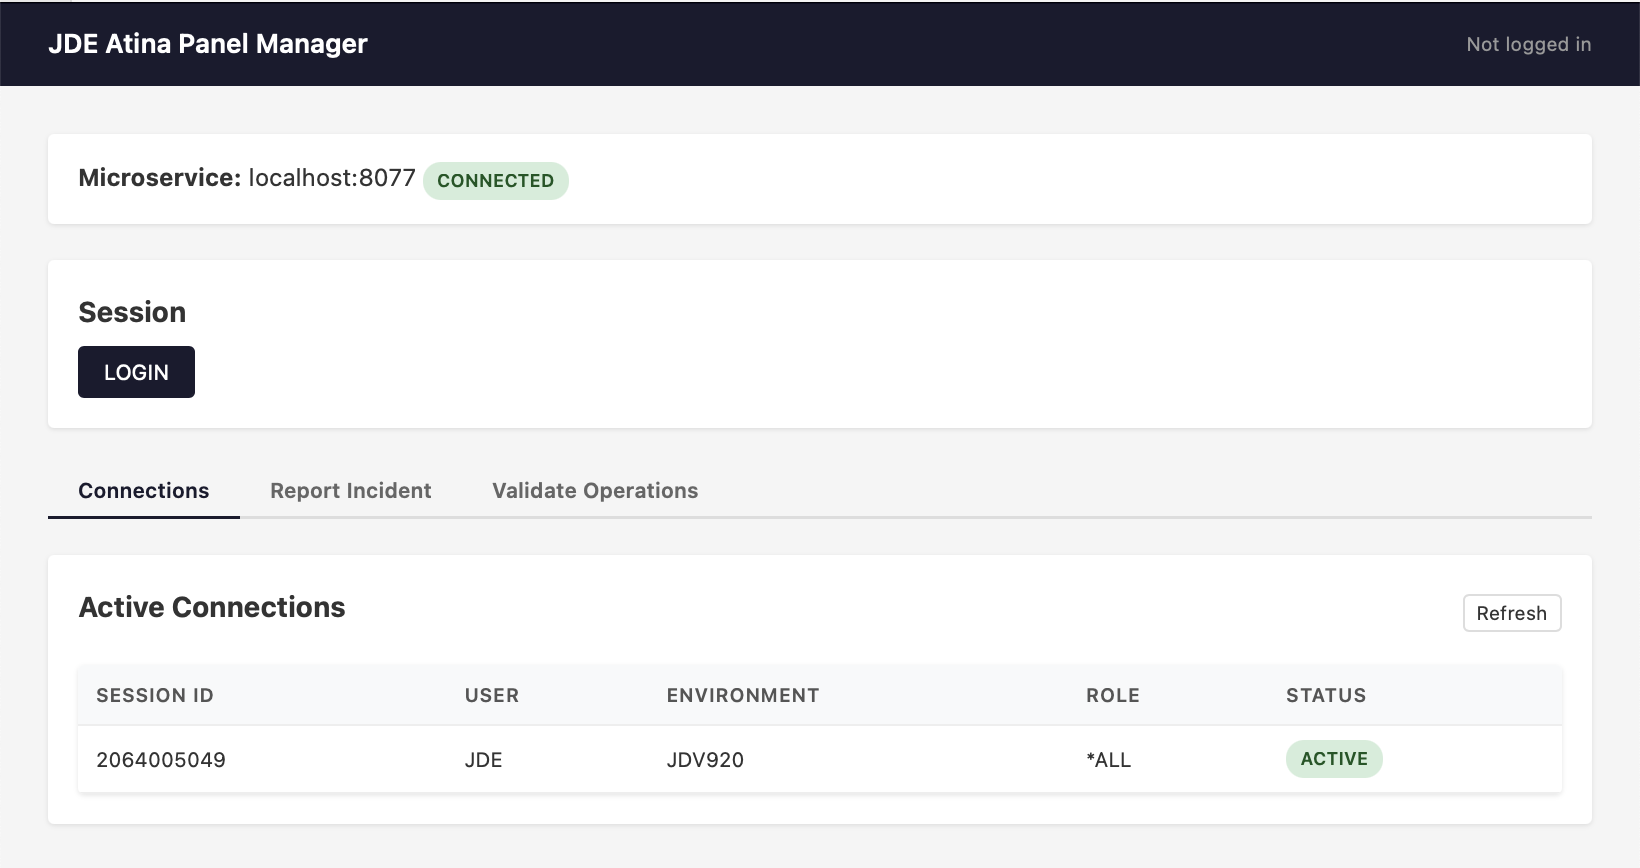
java -jar JDEAtinaPanelManager.jar --panel-port 8060 --host localhost --port 8077Since the microservice address is already known, the Panel skips the connection form and goes straight to the login screen.
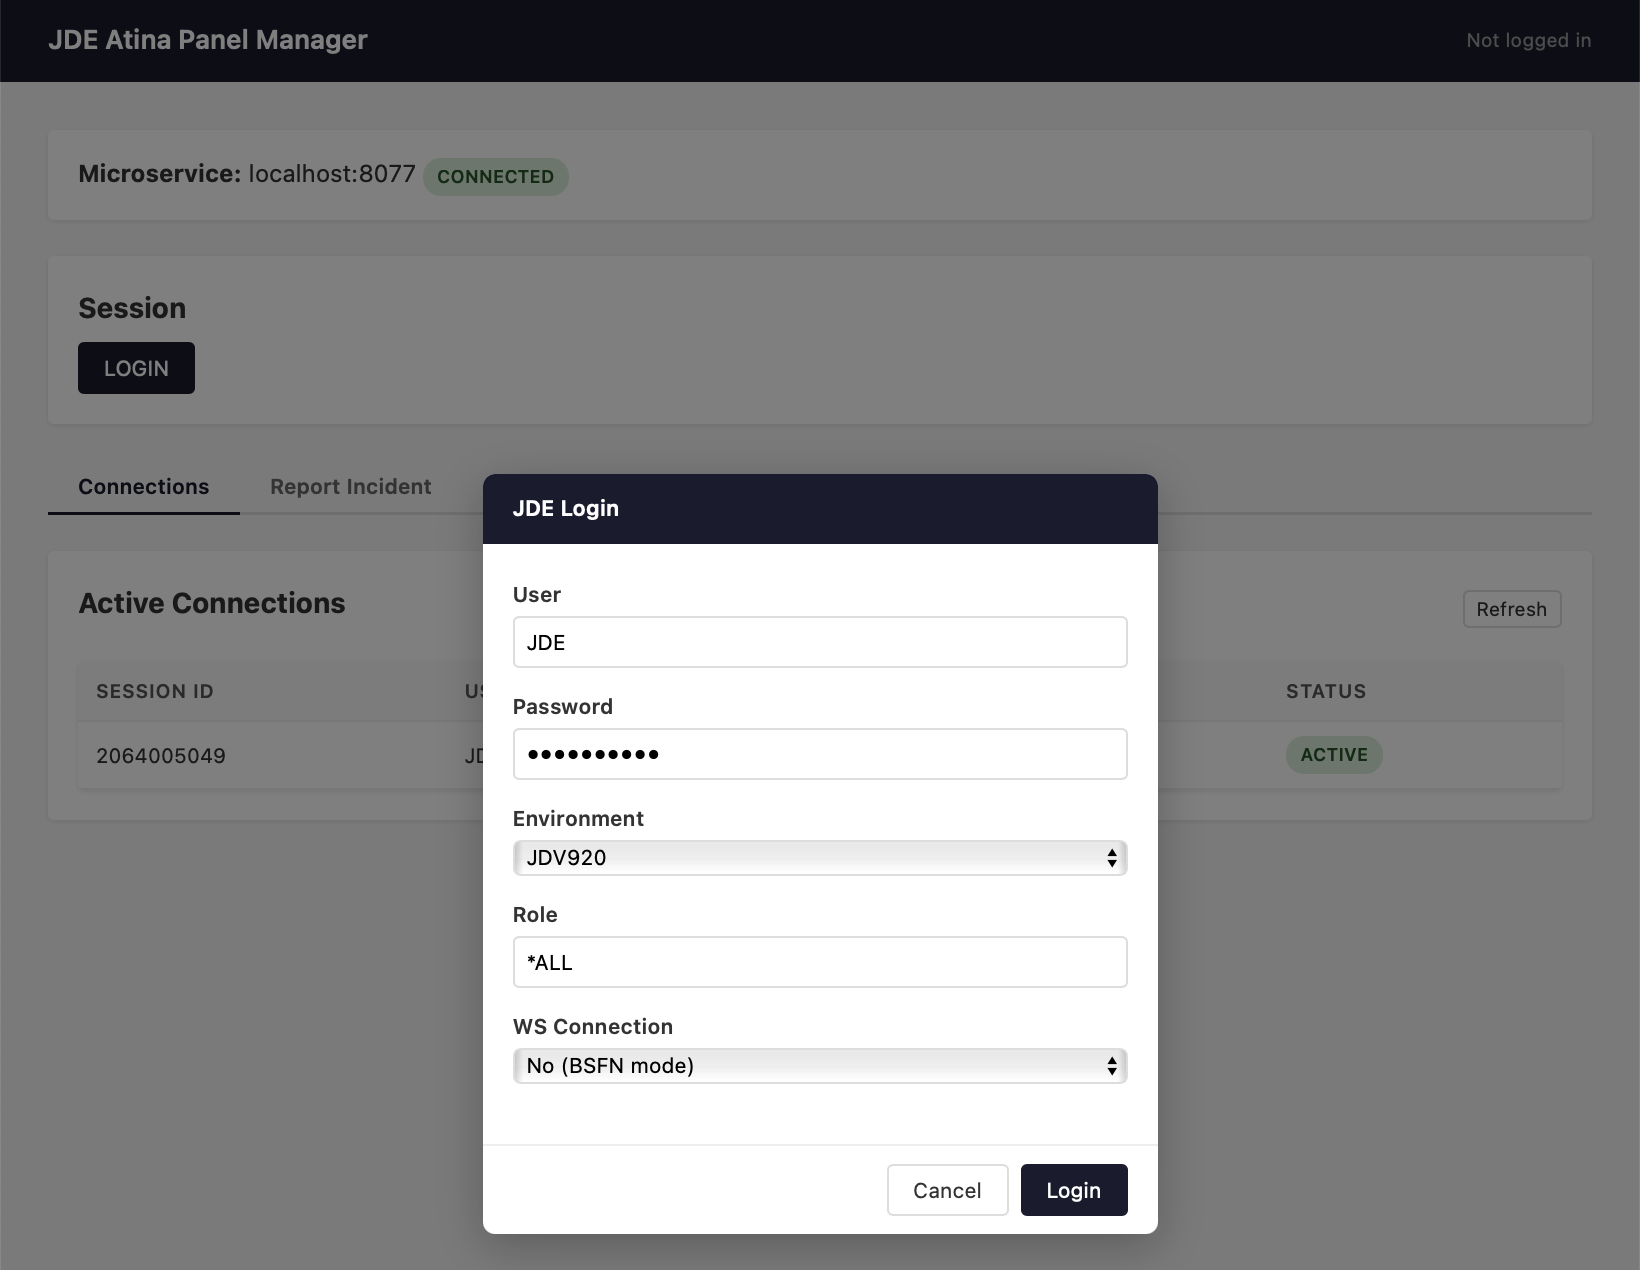
Enter your JDE credentials (User, Password, Environment, Role):
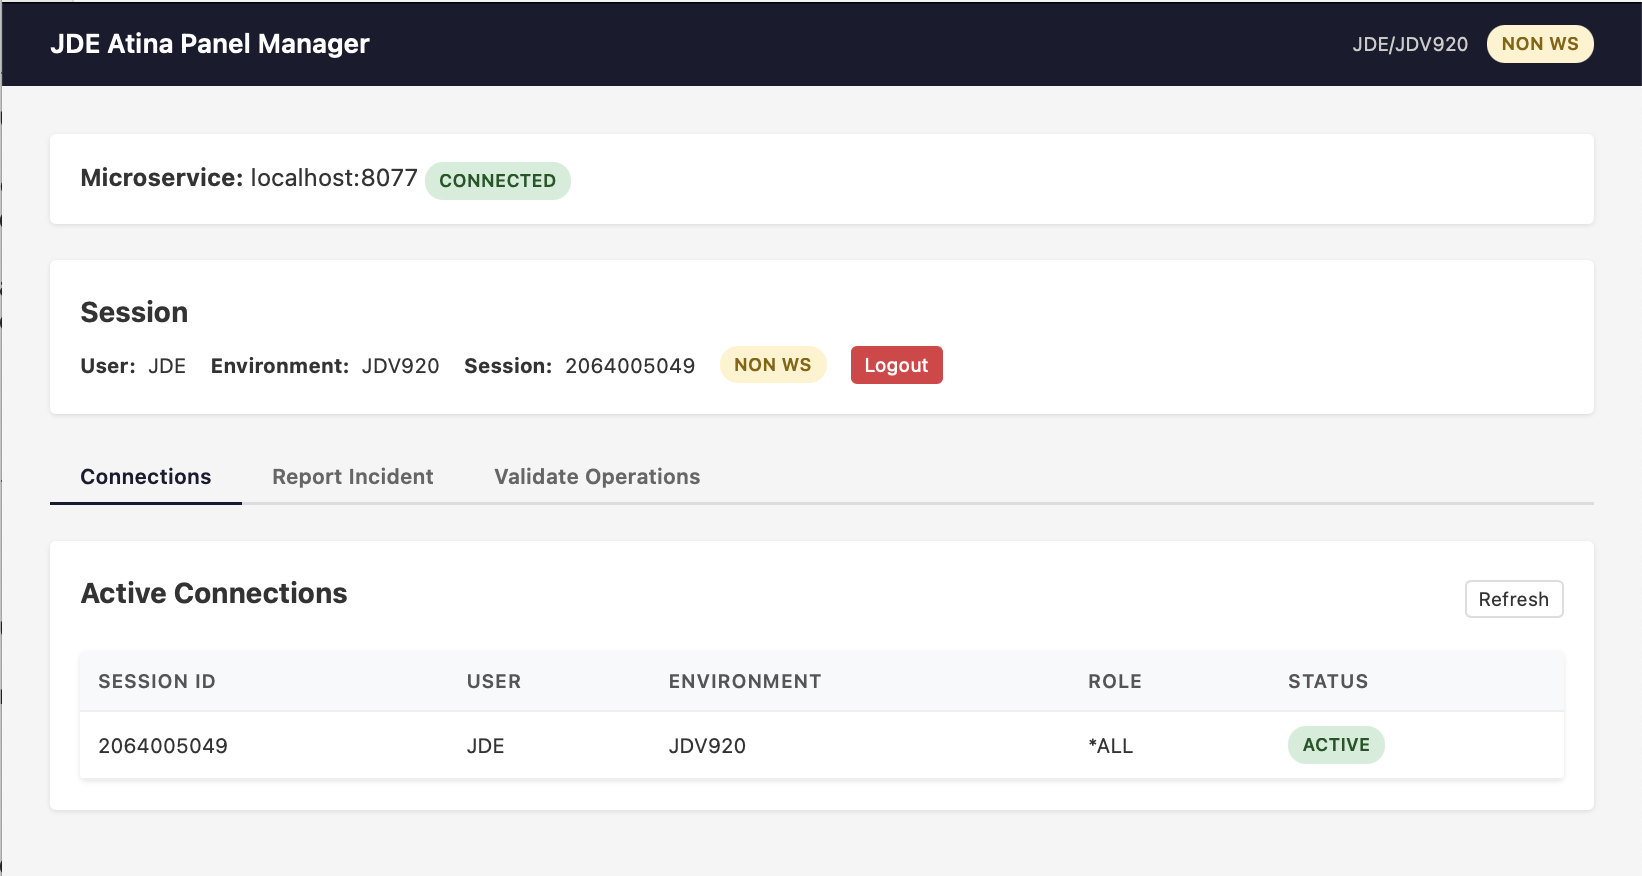
Once logged in, the dashboard is displayed:
Option 3 - Passing All Parameters (Scripting)
All parameters can be passed on the command line, including credentials, so the Panel starts already logged in. This is useful for scripts and automated startup.
java -jar JDEAtinaPanelManager.jar \
  --panel-port 8080 --host localhost --port 8077 \
  --tlsEnable --user JDE --password XXXXXX \
  --environment JDV920 --role "*ALL" \
--wsConnection false --open-browser true|
If |
Available parameters:
| Parameter | Description |
|---|---|
|
Panel web port (default: |
|
Microservice host (default: |
|
Microservice gRPC port (default: |
|
Enable TLS for the gRPC connection (default: |
|
JDE user, for auto-login |
|
JDE password, for auto-login |
|
JDE environment, for auto-login |
|
JDE role, for auto-login |
|
Log in with Web Services connection mode (default: |
|
Open the Panel in the browser on startup (default: |
|
Auto-login requires all four credential parameters together: |
Reporting an Incident
The Report Incident option collects everything needed to open a support incident into a single ZIP file — no need to manually gather logs or configuration files.
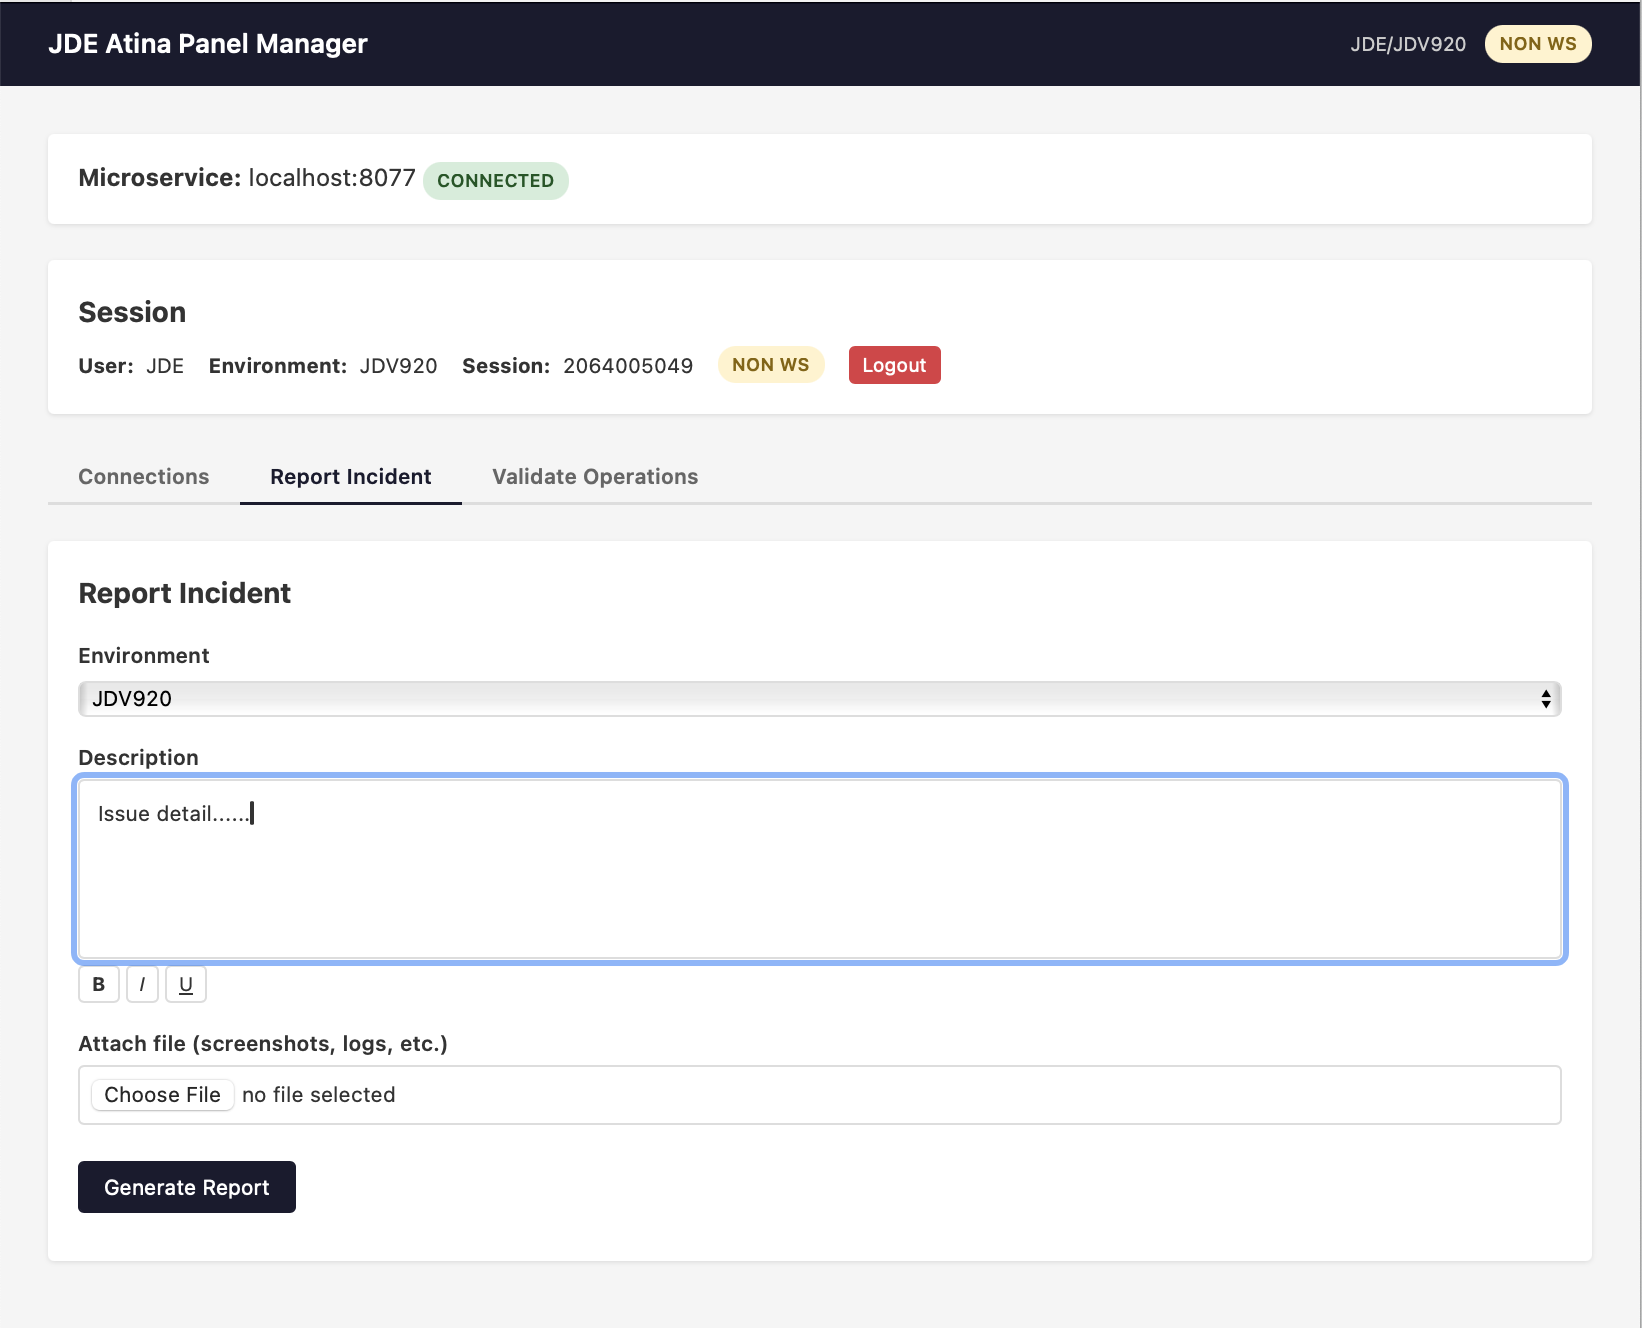
The ZIP includes:
-
The incident description you entered
-
Container files:
/tmp/jde,/tmp/jdelog,extra-hosts.txt -
A file listing of
/var/jdeatinaserver
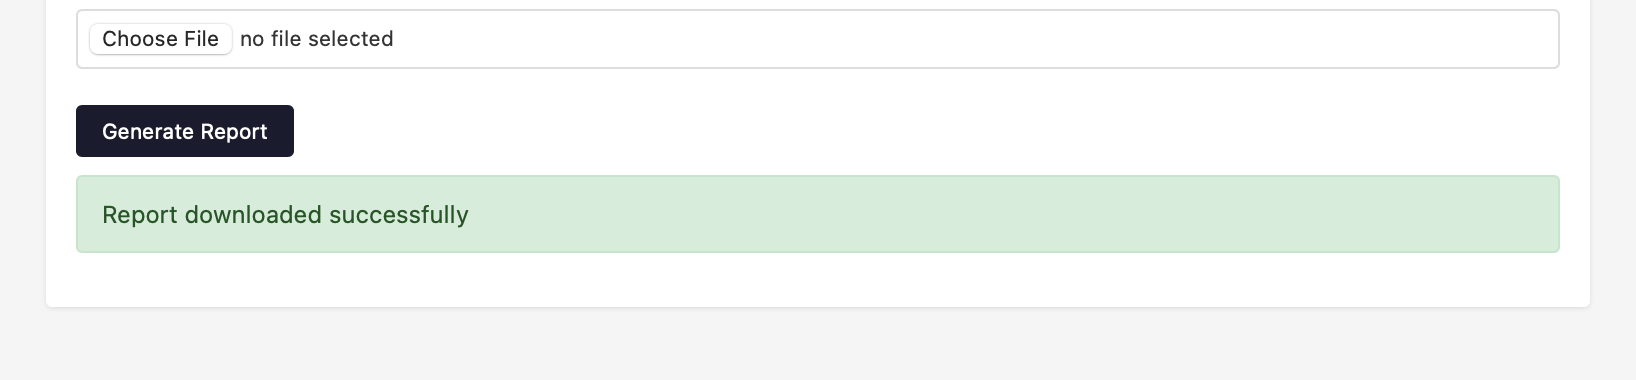
Once generated, download the file. It is named:
atina-report.zipSend this file to the Atina support team along with your incident description.
Validating the Microservice
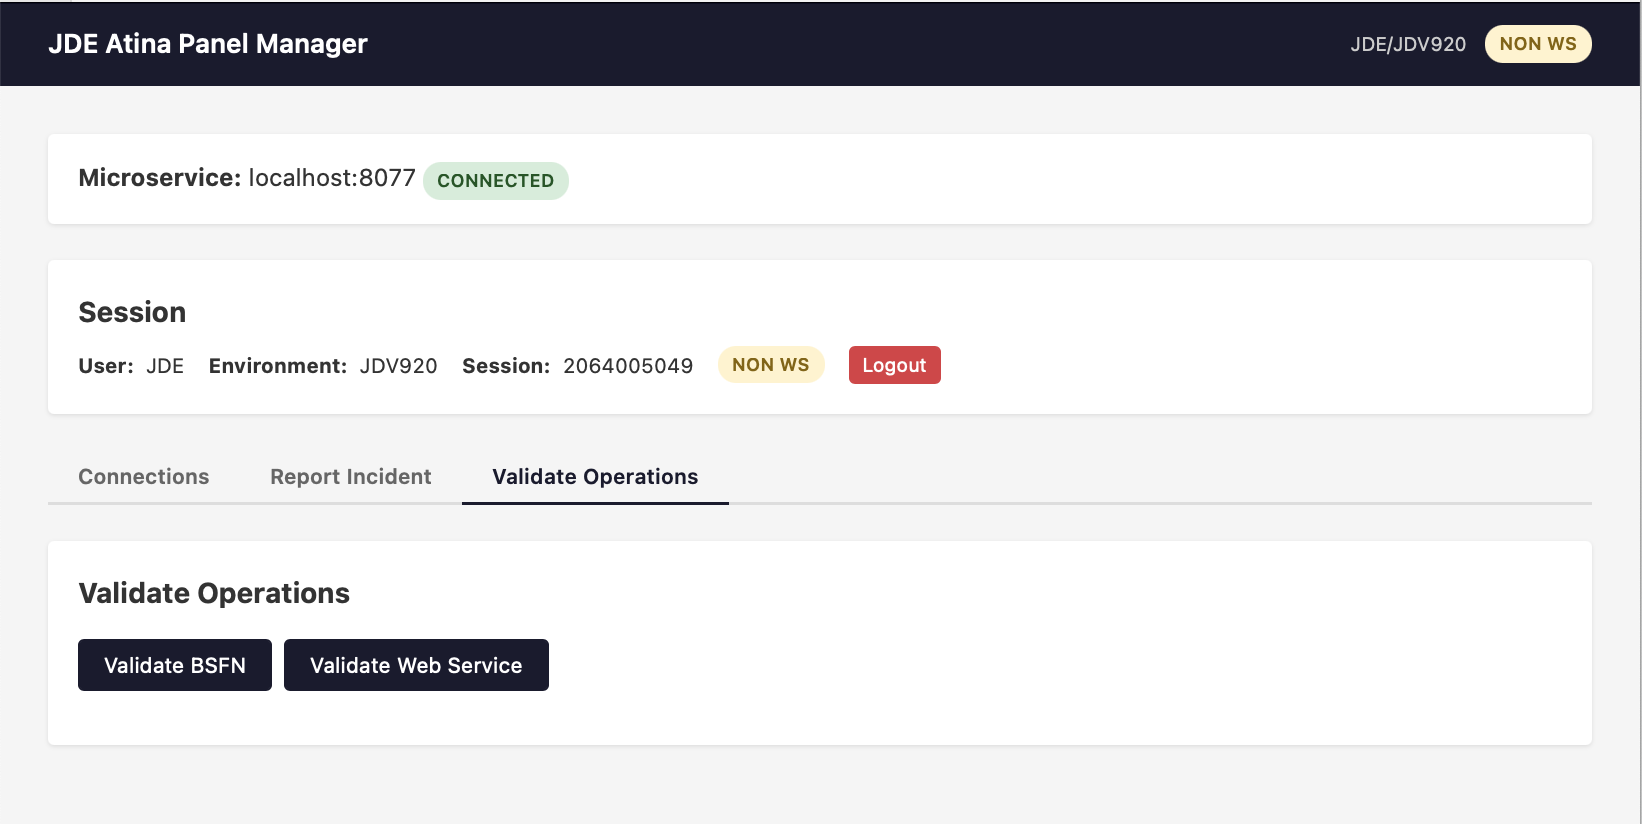
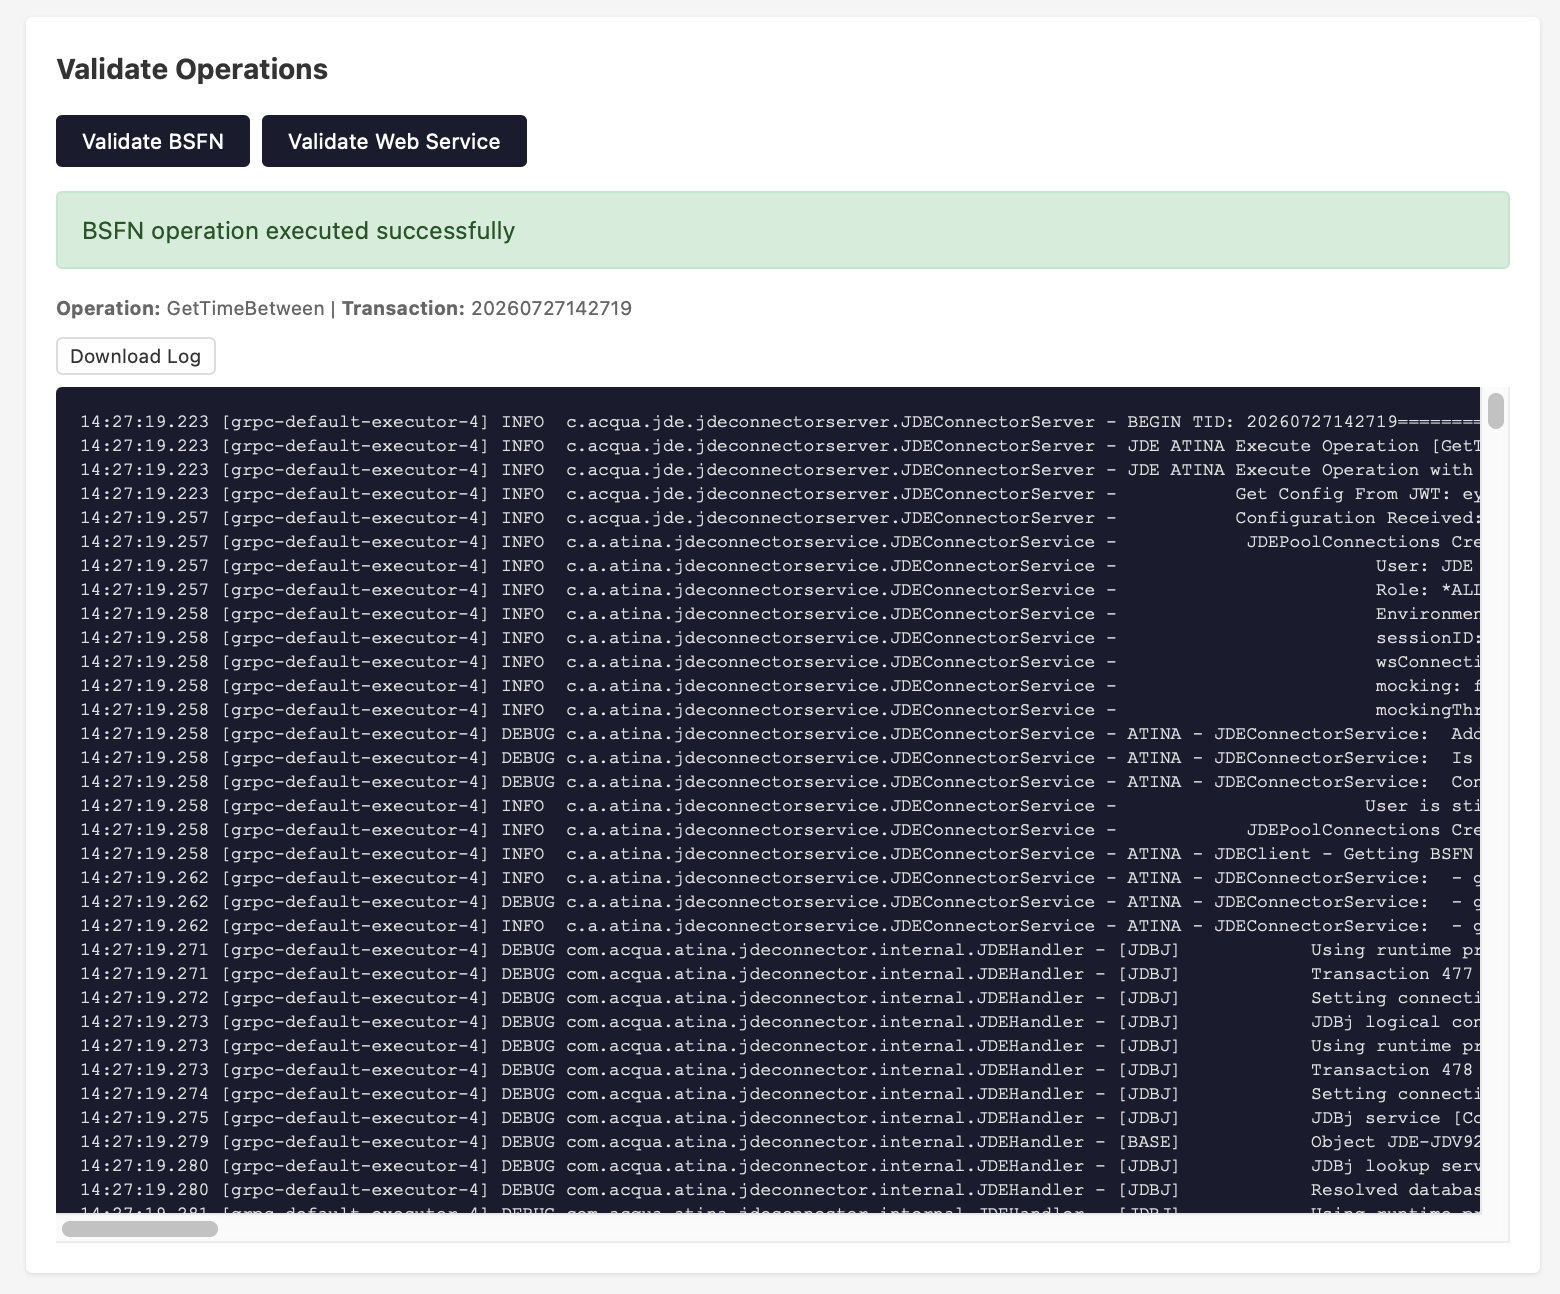
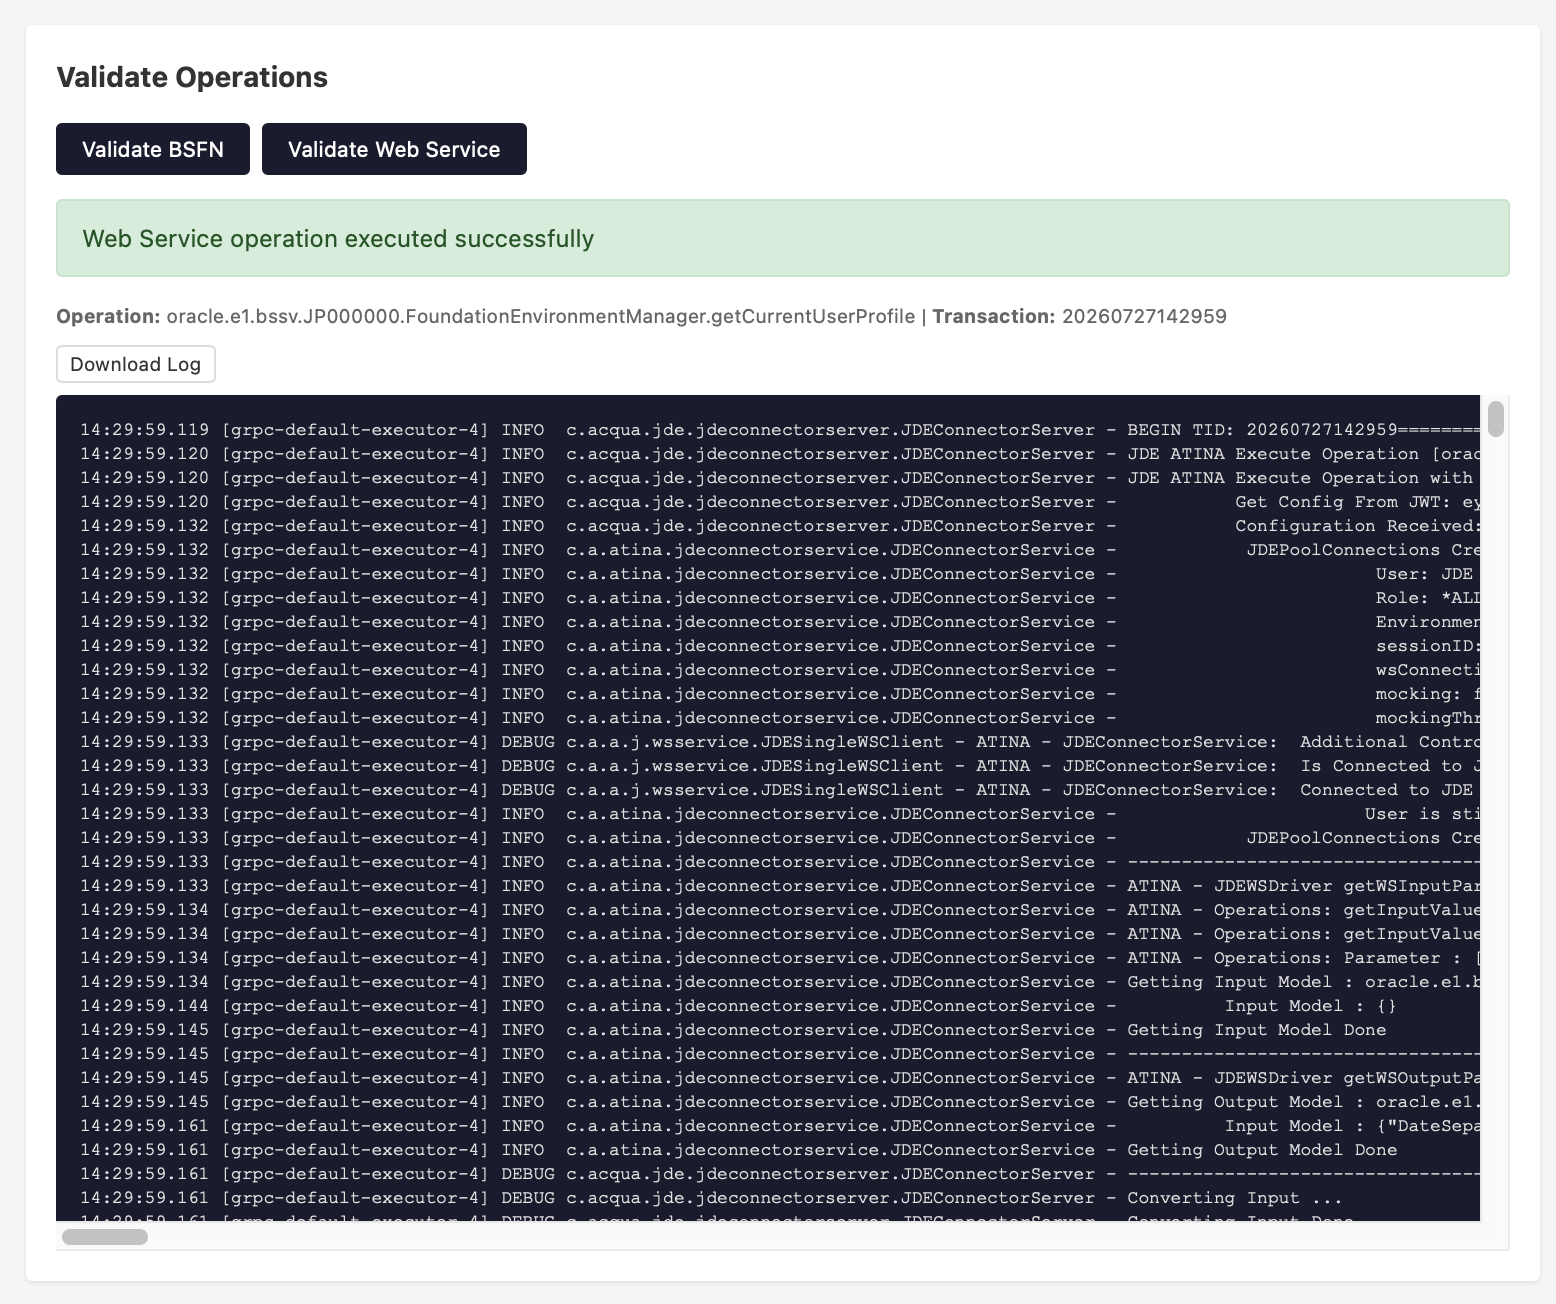
The Validate option lets you invoke a test BSFN and/or a test Web Service against the microservice, to confirm connectivity end to end.

|
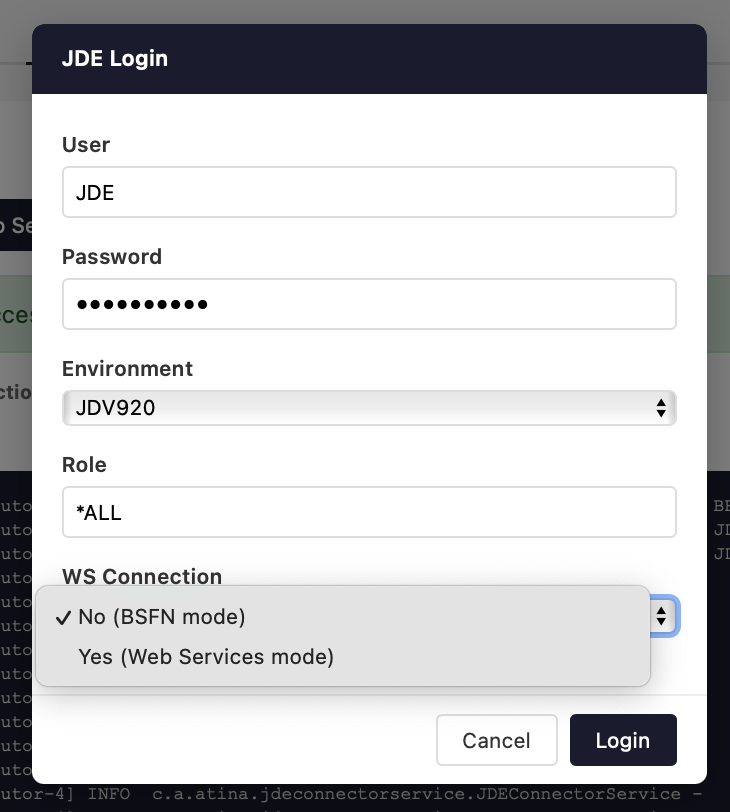
To validate a Web Service, you must be logged in with the WS Connection option enabled. If the Panel shows NON WS instead, it means the current session is not in Web Services mode: |
In that case, log out and log back in selecting the WS connection mode:


Support
If you have any questions or need assistance, contact support@atina-connection.com.